visualisation

The EdTech Hackathon 2013

To build educational apps suitable for classroom use by teachers and pupils.

// more

Date: 26 October 2013
Location: Google Campus, UK

Tag Clouds on Steriods: New Techniques for Visualising Social and Mass Media Big Data [video]

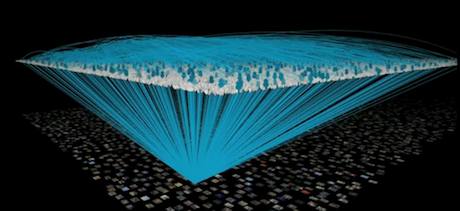
Screenshot from Deb Roy's TED Talk: Birth of a Word

I love me a Wordle. If you're the same and you're interested in some ground-breaking techniques to visualise big data in real-time this video is worth a watch.

Deb Roy's research starts with an experiment to parse 90,000 hours of video to chart his infant son's discovery of language through to analysis of online comments, sentiment and social connections during President Obama's State of the Union address.

// more

24 Hours of London's Tweets Visualised

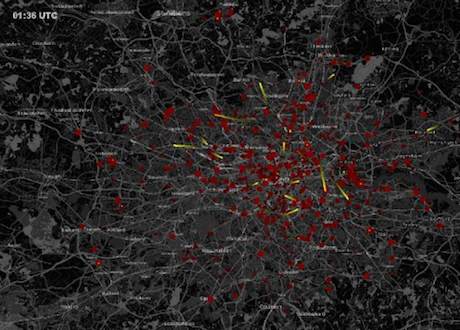
London Tweets 24h

This is a fantastic visualisation of 24 hours' worth of tweets across London. It's a great video - and choice material for social media presentations, I'd wager - that brings to life the way information is shared across a geography.

The red dots are the tweets, with the yellow streaks showing the direction of a retweet (RT) from the origin to the destination. Of course, this is just a fraction of the actual volume as most people don't have geolocation turned on.

// more

The Facebook Friend Map of the World

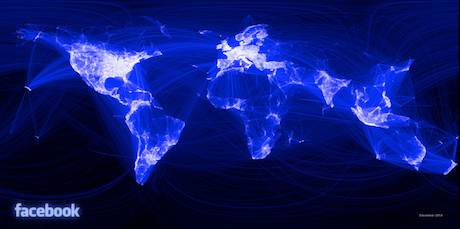
Infographic of the Day: The Facebook Map of the World by Paul Butler

Q: What happens when you let an intern loose with 10m lines of data and some processing power?

A: In the case of Paul Butler an intern with Facebook's data infrastructure engineering team, something rather special.

// more

It’s a treasure map but not as we know it


Ok it’s official. I’ve tried to deny it, talk myself out of it but I am indeed a geek. It’s true. Hey, it’s cool to be a geek. I would even go as far to call it chic. Geek-chic.

// more